"Your suppliers walk into every negotiation knowing exactly what's driving their costs. Most procurement teams don't."

Price increases you can't validate

Suppliers cite commodity and cost pressure. Without independent data, challenging a number is guesswork.

Negotiation prep done manually

Teams spend hours pulling market data from scattered sources — and still walk in under-prepared and under-resourced.

Lack of understanding of nowadays challenging environments

Most procurement functions operate on instinct. Equip your buyers with the right data-driven tools at the right time.

Advanced product's analytics, without the analyst headcount

Claros enables buyers to fully understand what your product is about — covering commodity trends, pricing signals, input cost dynamics, and supply disruptions. All together with the necessary market intelligence context to streamline the consumption.

  • Dedicated analysis and reporting for your catalog. Visualize trends, drivers, composition, etc.
  • AI chat interface for real-time market queries between reports and items
  • Relevant briefs tailored to your supplier context and timeline

What you receive

"Advanced product's analytics in hours, not weeks."

Visibility for the items under your responsibility

Advanced dashboards for streamlined consumption

Cadence

Your insights are generated immediately based on the latest available data.

Coverage

From raw materials to indirect costs, if you have the data we make it accessible.

Every price is a stack of drivers

A jar of peanut butter on a retail shelf is one number to a buyer — and seven to the supplier who quoted it. When the quote moves, Claros tells you which layer moved, by how much, and whether the market backs the claim.

  • Raw materials carry 72% of this price — and move with the commodity market
  • The remaining 28% sits in packaging, conversion, logistics, and energy
  • A 10% peanut rally is a 5.2% cost event — not the 10% you'll be quoted
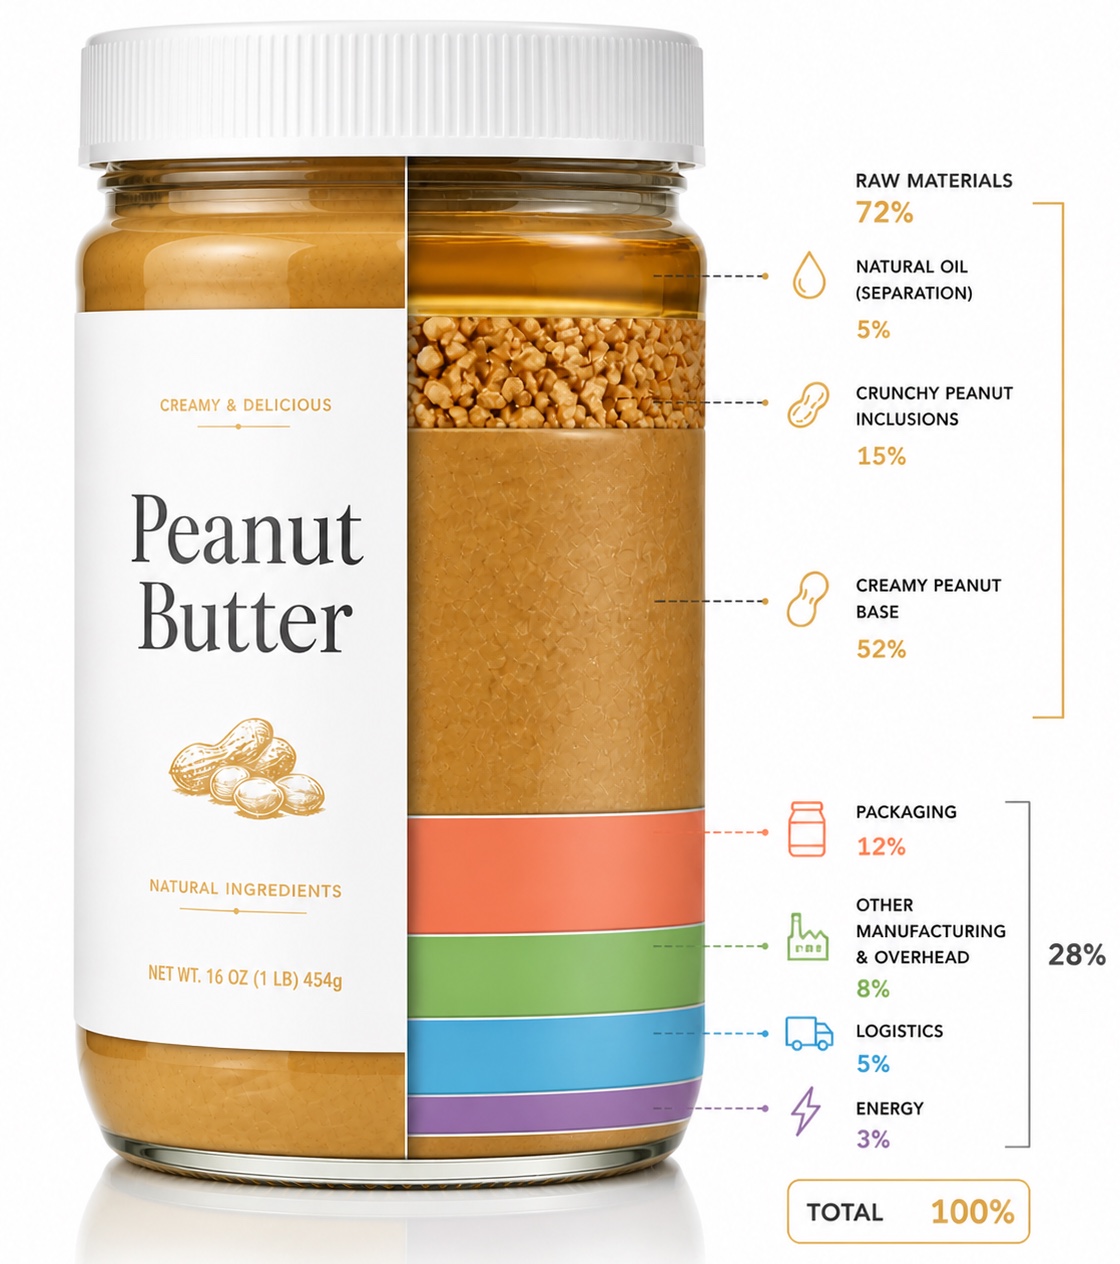
Cost breakdown of a 454g jar of peanut butter: raw materials 72% — creamy peanut base 52%, crunchy peanut inclusions 15%, natural oil separation 5% — plus packaging 12%, other manufacturing and overhead 8%, logistics 5%, and energy 3%, totalling 100%.
Illustrative example. Claros builds the same decomposition from your own catalogue, cost structure, and supplier quotes.

How it works

01

Select your categories and products

Prepare the cost structure — choose the commodities and cost drivers relevant to your supplier base.

02

Input your current supplier price

Claros decomposes the quote into its raw material, energy, labour, and FX components while projecting the evolution towards your target price.

03

Negotiate from the data

Walk into every negotiation with a validated cost position — and know exactly which claims to challenge.

See exactly what's behind every supplier price increase

The Claros platform decomposes any item price by raw material and cost driver exposure — commodities, energy, labour, and FX — giving your team the analytical leverage to challenge every supplier quote with precision.

  • Live cost-driver dashboards across unlimited categories
  • Supplier price benchmarking against validated market data
  • Market shift alerts before increases reach your inbox

Get in touch to start your pilot.

Try Claros across categories — low commitment, fast value, and a clear picture of what the intelligence unlocks for your team.

Request a Pilot